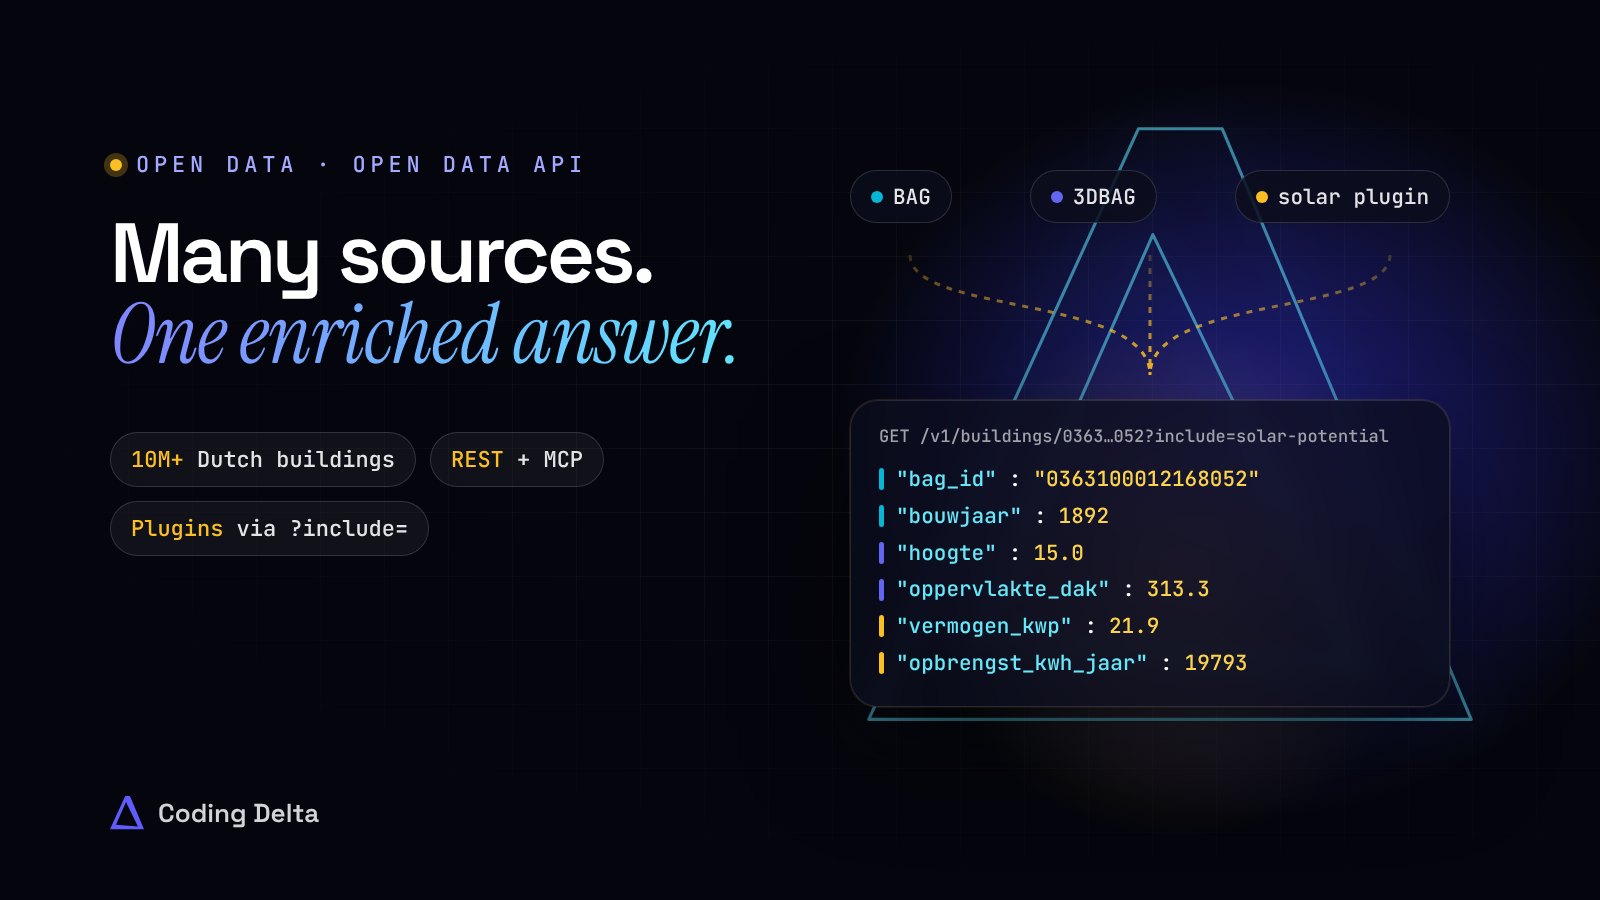
Ask a simple question about a Dutch building, like "how much roof does this house have, and how many solar panels fit on it?", and you quickly find out how scattered the answer is. The address and construction year are in one register. The height, roof planes and volume are in a 3D model of tens of gigabytes. And the number you actually need, the solar yield, isn't stored anywhere: someone has to calculate it.
That's why we built Open Data API: one API that takes all of those sources, links them per building and enriches them into a single answer. For more than 10 million buildings in the Netherlands, ready for your application or your AI agent.
Key takeaways
- One request, many sources. Address and building records from the BAG and 3D geometry from the 3DBAG come back linked in one response.
- Enrichment on the fly. Add
?include=plugins such as solar potential, renovation quantities or a neighbourhood comparison, and the derived numbers are calculated and merged into the same answer. - Built for AI agents too. An MCP server exposes every endpoint and plugin as a tool, so Claude, Cursor or your own agent can look up buildings and run calculations by itself.
- No 40 GB import. We host, index and update the data in the EU. You do one request.
- Lead lists from five open sources. For construction, installation and sustainability work, the 3DBAG, BAG, energy labels, monument data and zoning plans are combined into daily-updated lead lists.
- Free to try. The Starter plan includes 50 requests a month, all core endpoints and the free plugins, with no credit card. A test key lets you try any plugin on demo buildings.
The problem: the data is open, but not usable
The Netherlands has some of the best open building data in the world. The BAG, the national register of addresses and buildings run by the Kadaster, knows every address, construction year and use. The 3DBAG, made by TU Delft and 3DGI, models every building in 3D: heights, roof planes, walls and volumes, at several levels of detail.
But "open" isn't the same as "usable". To combine them you need to download and import the full 3D dataset, keep up with new releases a few times a year, link the 3D buildings to the right addresses, and then write the calculations that turn geometry into answers: square metres of south-facing roof, panel counts, quantities for a quote. That's weeks of data engineering before you answer the first customer question.
The solution: enrichment as a service
Open Data API does that work once, for everyone. Every request goes through the same three steps.
1. Find the building
Search by postcode and house number, or go straight to a BAG ID. One call takes you from an address to the building, including its use and surface area.
2. Combine the sources
The building record comes back with the data from both registers linked together: construction year and status from the BAG, and from the 3DBAG the number of storeys, ridge and ground height, volume, and the ground, roof and wall surfaces. If you need the shape itself, you get the 3D geometry at LoD 1.2, 1.3 or 2.2 as GeoJSON, in Dutch RD/NAP coordinates or WGS84, ready for Cesium or deck.gl.
3. Enrich with plugins
This is where it gets interesting. Add a plugin to the same request with ?include= and the API calculates new values on top of the combined data and merges them into the answer.
curl api.opendataapi.nl/v1/buildings/0363100012168052?include=solar-potential \
  -H "Authorization: Bearer oda_live_…"
{
  "bag_id": "0363100012168052",
  "bouwjaar": 1892,
  "daktype": "slanted",
  "hoogte": 15.0,
  "oppervlakte_dak_schuin": 313.3,
  "volume": 2880,
  "plugins": {
    "solar-potential": { "vermogen_kwp": 21.9, "opbrengst_kwh_jaar": 19793 }
  }
}
The ID and construction year come from the BAG, the roof type, height, roof area and volume from the 3DBAG, and the solar capacity and yearly yield from the plugin. That's three sources and one answer, without a single line of GIS code on your side.
Plugins: from data to decisions
Plugins turn building data into the numbers a business actually works with. Today the marketplace includes:
- Roof insights (free): every roof plane with its slope, orientation and area, in one call.
- Renovation calculator: quote-ready square metres for roof, walls and insulation.
- Solar potential: kWp, kWh and the number of panels per roof plane.
- Neighbourhood comparison (free): how a building compares with the buildings around it.
- Label C check for offices: does the energy-label C obligation apply, and does the office meet it?
- Topping-up scan, built by an outside partner, Bovenop Studio: can a building take an extra storey, and how many extra m² and homes would that add?
Paid plugins are booked one by one, as a separate monthly subscription on top of Pro or Enterprise.
And anyone can build one, as the topping-up scan shows. A plugin is a JSON manifest that describes which datasets it reads, which parameters it takes and how the output is calculated. There's no server to run and no deployment. You test it in a sandbox against real buildings, submit it for a review within two working days, and earn 70% of the revenue of paid plugins, with payments handled through Stripe. Every plugin is automatically available via REST, ?include= and MCP.
Made for AI agents
More and more software isn't clicked by people but called by AI agents. Open Data API has an MCP server: connect it to Claude, Cursor or your own agent, and every endpoint and every plugin you've activated shows up as a tool.
Ask your assistant "How many m² of roof does Dam 1 in Amsterdam have, and how many solar panels fit on it?" and it searches the building, runs the solar plugin and answers with real numbers instead of a guess.
Leads & insights: enrichment at scale
The same enrichment also works the other way round. Instead of asking about one building, you ask which buildings in your region match your market. For that, Open Data API adds three more sources to the 3DBAG and the BAG: energy labels from EP-Online, monument status from the Cultural Heritage Agency (RCE) and zoning plans. Together they produce lead lists per building and per region, updated every day:
- Label C radar for offices. Offices without energy label C may no longer be used, and 24% of office addresses still have no energy label at all. The list shows them per region, with m², construction year and roof area.
- Landlord radar E/F/G. Rental homes with label E, F or G must reach at least label D by 1 January 2029. The list finds the housing complexes with the biggest task, including roof and wall areas for a first estimate.
- Solar on business roofs. Flat commercial roofs of 120 to 5,000 m² are the largest untapped solar segment. Each roof comes with its area, orientation, kWp and yearly yield, with monuments already filtered out.
- Topping-up and transformation. Post-war flats with a flat roof, no monument status and room under the maximum building height, ranked per municipality by extra storeys, m² and homes.
The lists are private by design. They contain no names, phone numbers or e-mail addresses of private individuals. Private homes appear only aggregated per neighbourhood or street, and only open government data is used, always with the source.
Who uses it
Open Data API is built for anyone who needs building facts without a data team:
- Roofers and insulation companies who want to quote the same day, without measuring on site first.
- Solar installers who estimate panels, kWp and yield for any address in the Netherlands.
- Energy advisers who need the building's shape and age before the first visit.
- Insurers and valuers, for whom rebuild value starts with volume and construction year.
- Researchers, municipalities and proptech teams who analyse whole neighbourhoods by bounding box and export 3D geometry for simulations.
Open data, handled properly
The building data comes from the 3DBAG (TU Delft / 3DGI, CC BY 4.0), linked to the BAG of the Kadaster. The lead lists add EP-Online energy labels, RCE monument data and zoning plans. We import every new 3DBAG release, which happens a few times a year, and the release number is in the changelog. Everything is hosted in the EU.
Pricing
- Starter (free): 50 requests a month, all core endpoints and the free plugins, with e-mail support within a week. Meant for developing, testing and small projects.
- Pro (€49 a month): 10,000 requests a month, the MCP server for AI agents, the option to add paid plugins, and e-mail support within one working day.
- Enterprise (custom): unlimited requests, a 99.9% SLA, bulk exports (fair use), private plugins and payment on invoice.
All prices exclude VAT and plans can be cancelled monthly.
Why we built it
We work with this data all the time. For our client KnopOm, for example, we built a data platform for bulk home renovation that combines address, energy-label and 3D building data to find comparable homes. Every time, the hard part wasn't the application but the plumbing: importing, linking, keeping up to date and calculating. Open Data API is that plumbing as a product, so the next team can start with the answer.
Your first request is two minutes away: create a free account at opendataapi.nl.
Curious what this could do for you?
We're happy to think along — over coffee on the Keizersgracht or on a video call.